 Categories
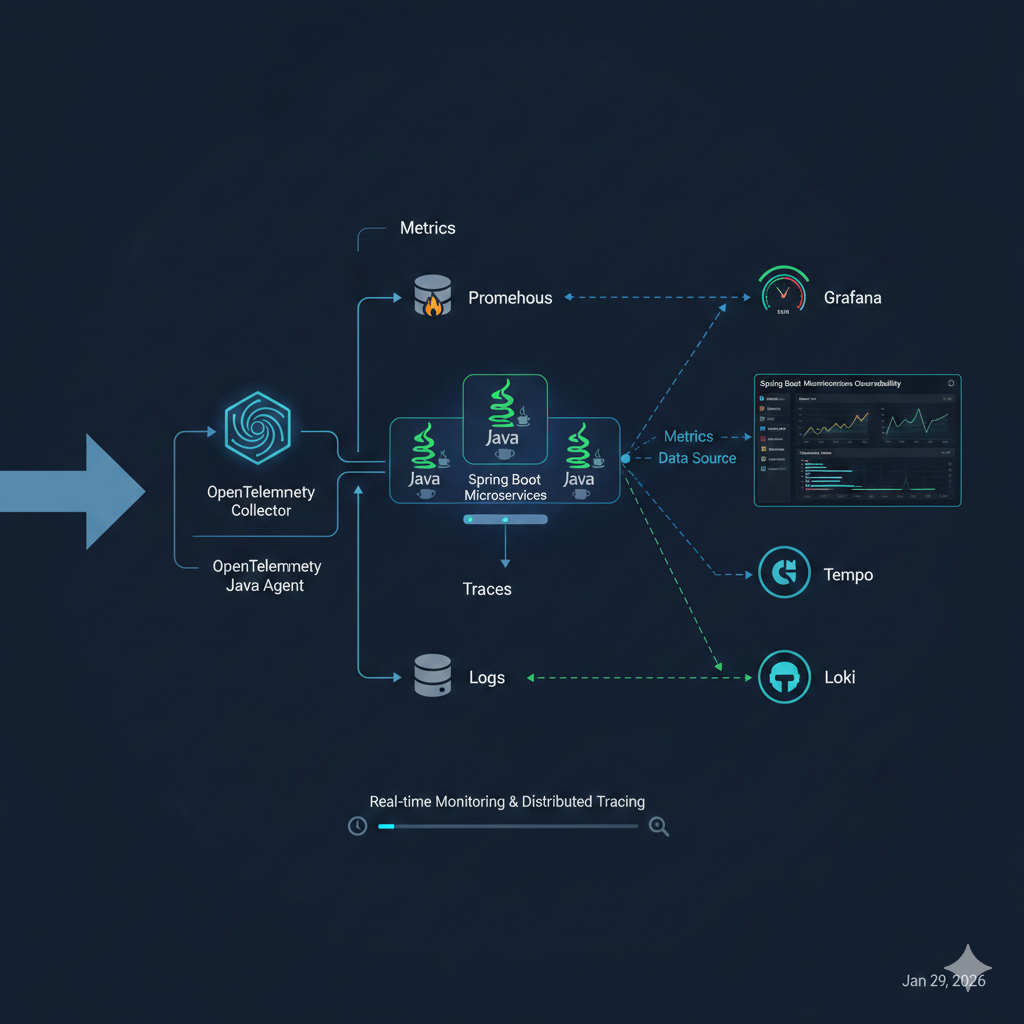


introduction
☰

Introduction To Grafana and Prometheus
- (0 Reviews)
- 15 students enrolled
Introduction To Grafana and Prometheus
This training introduces Prometheus and Grafana, two core tools for modern monitoring and observability.
- (0 Reviews)
- 15 students enrolled
Requirements
- Prometheus and Grafana
Description
Introduction to Grafana and Prometheus (Team Training) Prometheus is a monitoring system used to collect and store metrics from applications and infrastructure. It works on a pull model, meaning it regularly scrapes metrics from services (like Spring Boot /actuator/prometheus) at fixed intervals. Prometheus helps answer questions like “Is the service healthy?”, “Is error rate increasing?”, and “How is performance changing over time?”. Grafana is a visualization and analytics platform. It does not collect data itself. Instead, it connects to data sources like Prometheus and displays metrics using dashboards, charts, and alerts. Grafana helps teams quickly understand system health and spot issues through clear visuals. Together, Prometheus collects the data, and Grafana makes it easy for teams to monitor, analyze, and act on that data in real time.
Recent Courses
- June, 19th 2026
- 14
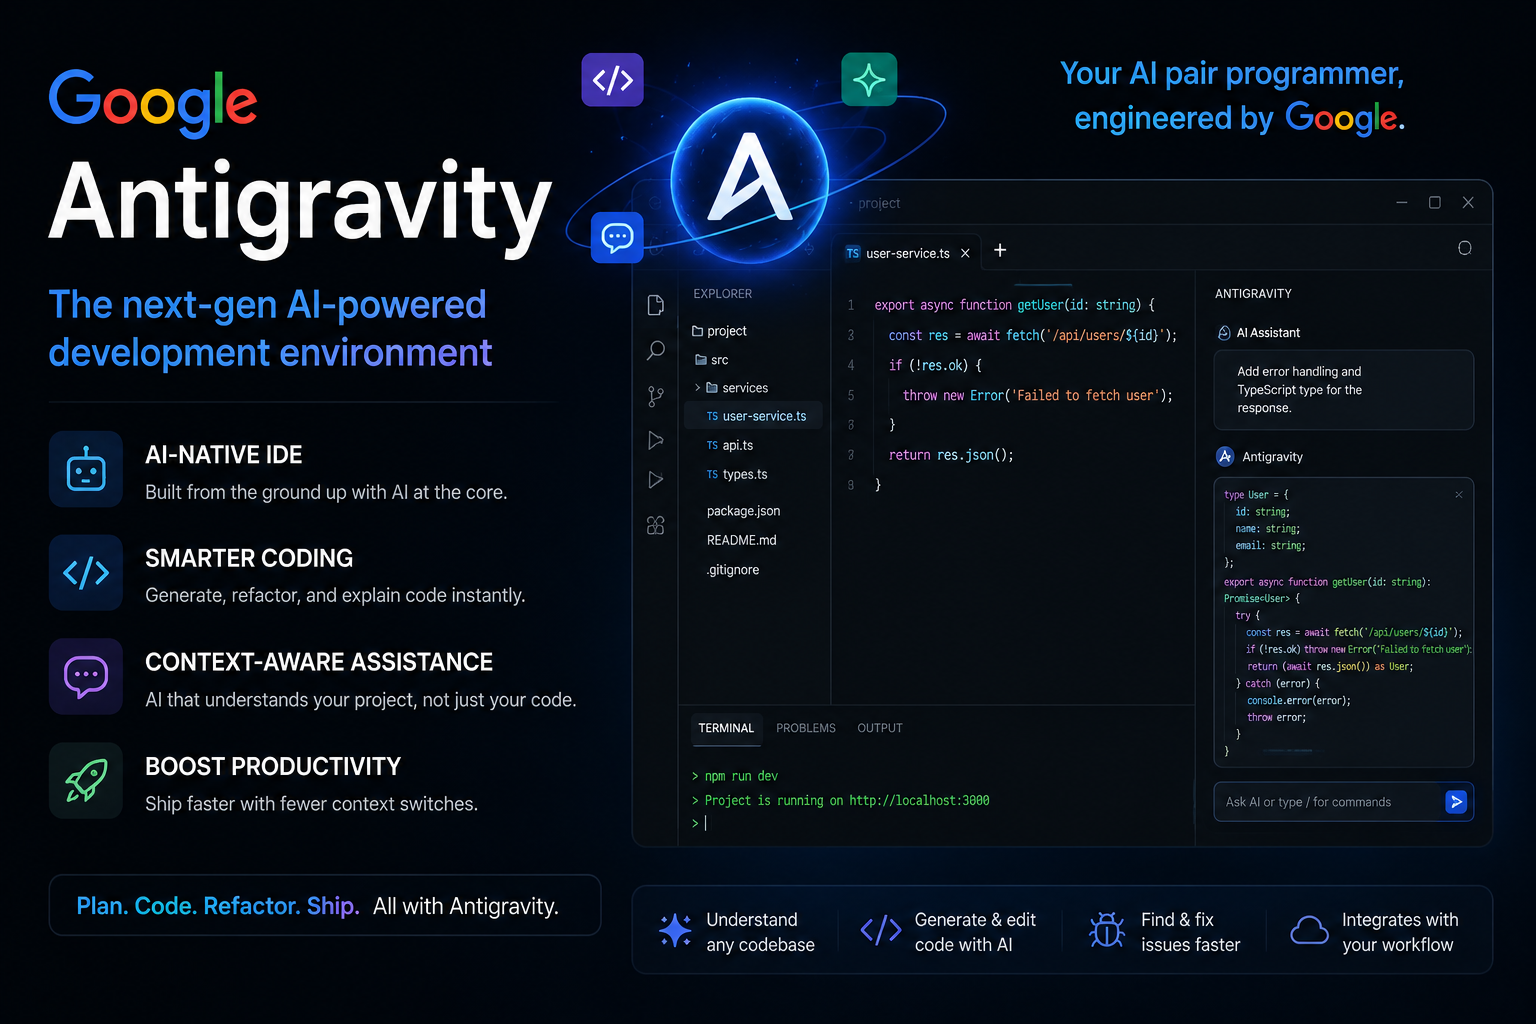
Google Antigravity is a fun and interactive web experiment inspired by Google's famous Easter eggs. Unlike Google Gravity, wh..
- Free

- June, 12th 2026
- 15
Playwright JS Automation and Scripting is a modern web automation framework developed by Microsoft for testing and automating..
- Free

- March, 25th 2026
- 14
Security Awareness Training :2025-2026 :Q4
- Free
- March, 25th 2026
- 13
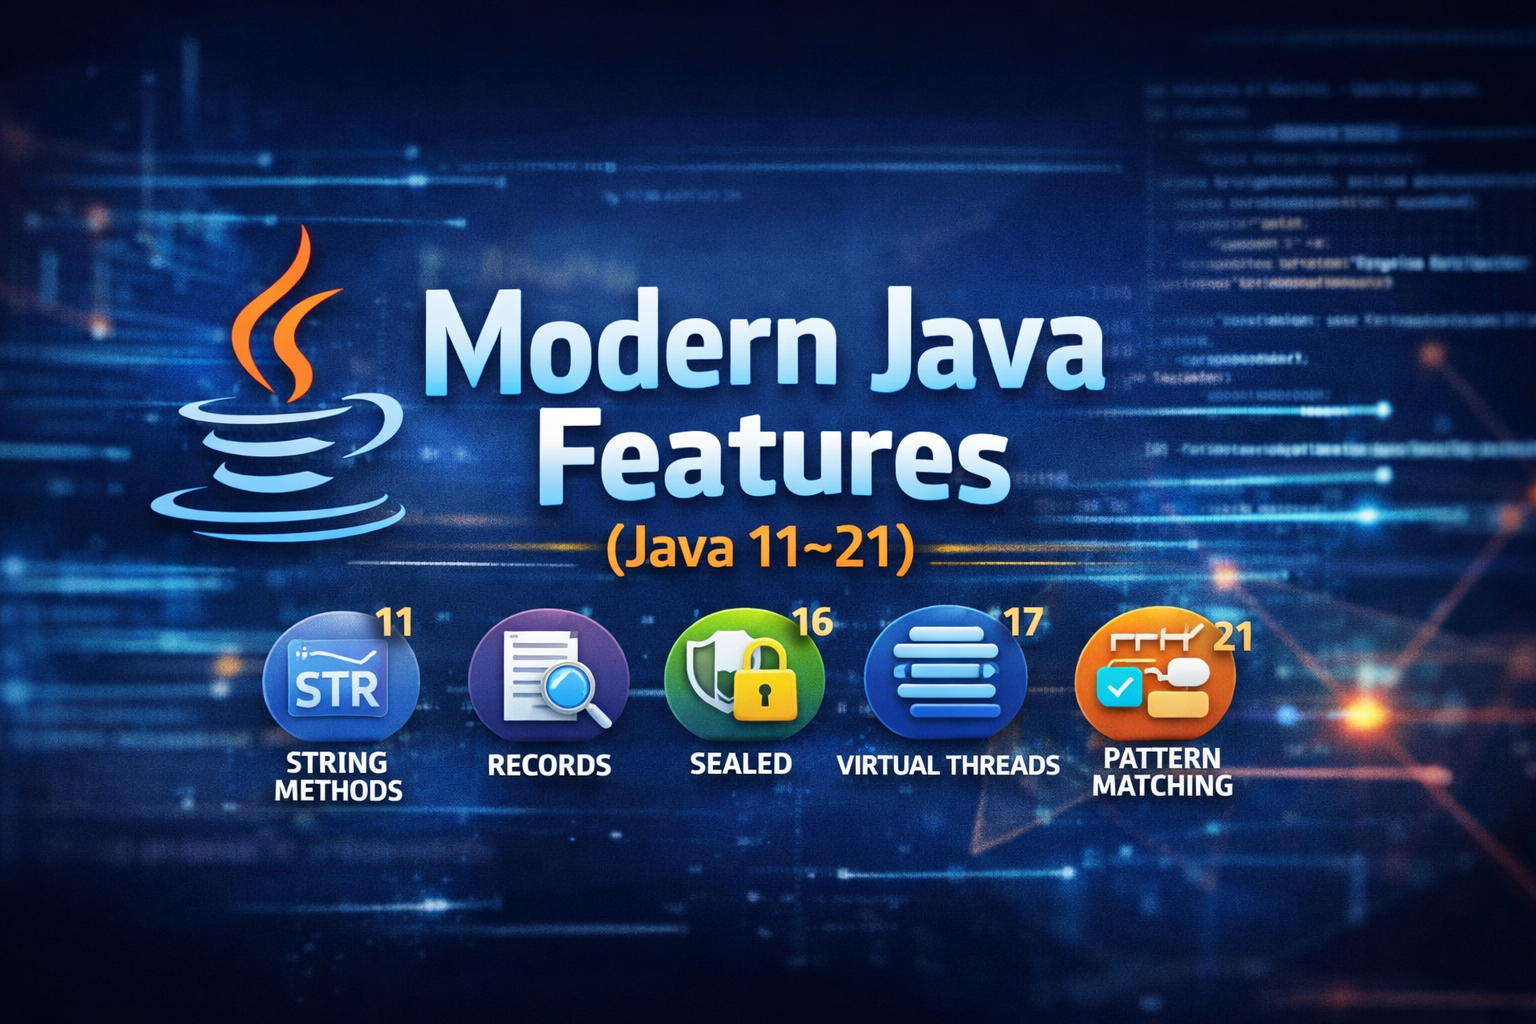
Modern Java (11–21) introduces powerful features that make code more concise, readable, and efficient. It reduces boilerplat..
- Free
About Instructor

About Instructor