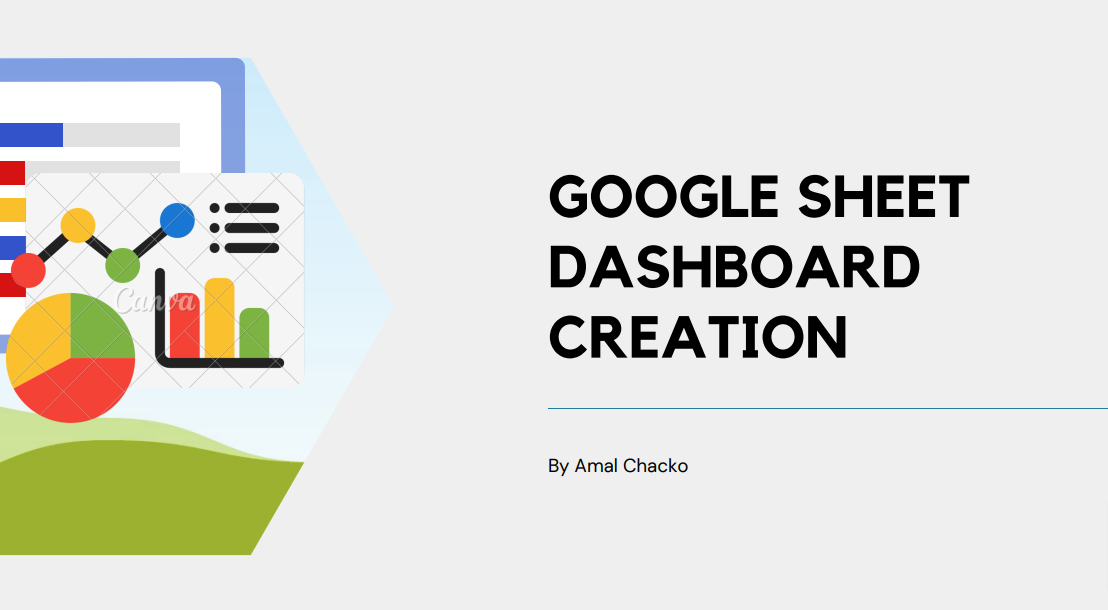
Google Sheet Dashboard Creation
-
- 3.3 rating
- (1 Reviews)
- 20 students enrolled
Google Sheet Dashboard Creation
Google Sheet Dashboard: Visualize data with charts, graphs & insights in a user-friendly format for informed decision-making.
-
- 3.3 rating
- (1 Reviews)
- 20 students enrolled
Course Content
Requirements
- Gmail Account
Description
Google Sheet Dashboard Creation refers to the process of designing and setting up a visual representation of data using Google Sheets. It involves organizing and analyzing data within Google Sheets and creating visually appealing charts, graphs, and other visual elements to present the data in a meaningful and easily understandable manner. Dashboards can provide an overview of key metrics, trends, and insights, allowing users to quickly and efficiently analyze data and make informed decisions. By utilizing various features and functionalities within Google Sheets, such as formulas, conditional formatting, and data visualization tools, a Google Sheet Dashboard can be customized to suit specific data analysis and reporting needs.
Recent Courses
- January, 29th 2026
- 7
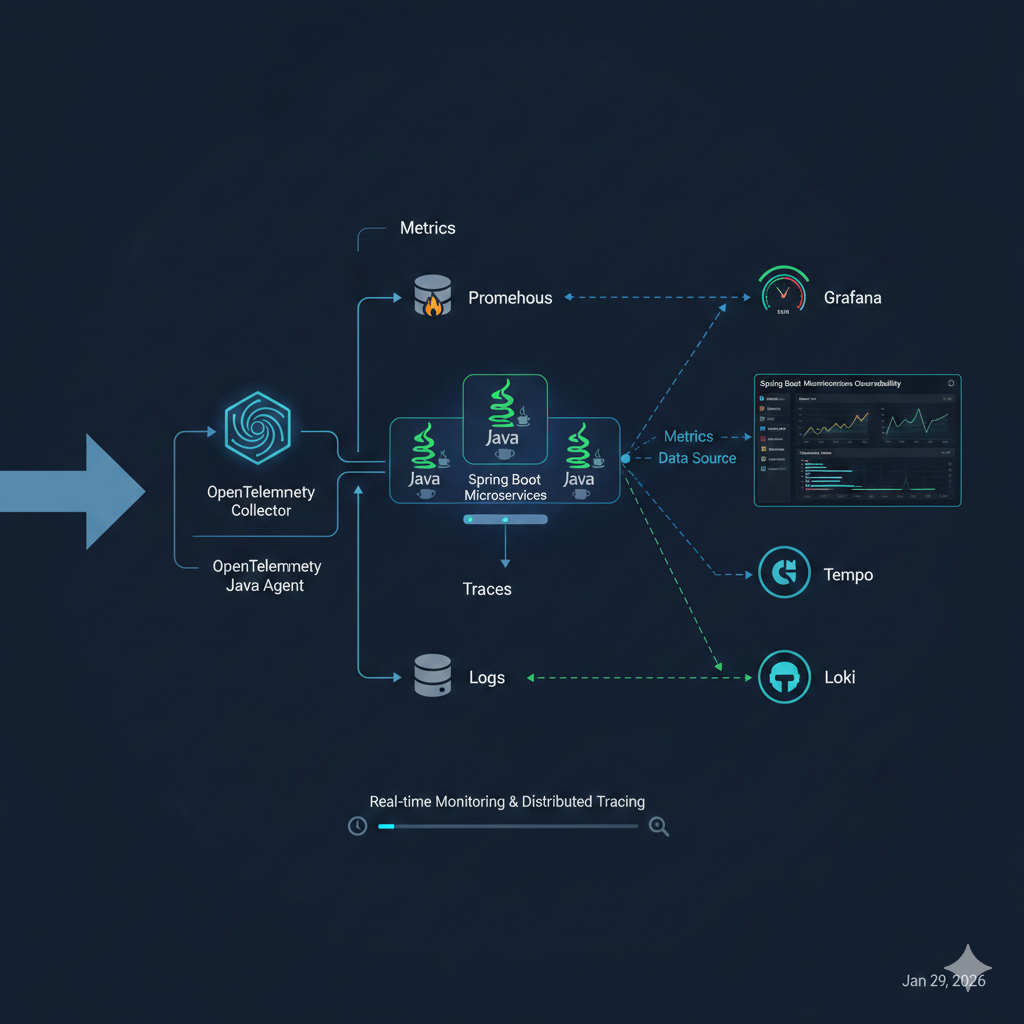
This training introduces Prometheus and Grafana, two core tools for modern monitoring and observability.
- Free
- January, 19th 2026
- 13
An introductory guide to Vue.js covering its core concepts, features, and how to get started building modern web applications..
- Free
- January, 14th 2026
- 13
Flutter – API Integration with JSON Parsing and UI
- Free
About Instructor

Experienced in generating reports from DB like SQL and MongoDB using Python, JS and DataBricks for Business Analytics, Revenue growth etc. Worked in Real time testing and debugging of any issues and working with Dev Teams for fixture of the same, Conduct KT for the team. Making back-end changes in the DB via scripts, queries, codes, APIs as and when necessary.

 Categories


